News | USC's Luciano Nocera presents Freight Modeling Research
Stop the VideoNews
USC's Luciano Nocera presents Freight Modeling Research
Wednesday, September 29, 2021
by Hayley Rundle, USC, Masters of Urban Planning 2022
On September 22, METRANS and the Pacific Southwest University Transportation Center (PSR), along with special partners the University of Southern California chapter of the Institute of Transportation Engineers (ITE), launched their second in-person and online research seminar of the Fall 2021 seminar series. USC ITE is a student group of engineers, planners, and thinkers who aim to reimagine transportation systems. James Huang, the vice president of ITE at USC and an industrial and systems engineering student, shared that “ITE is excited to be sponsoring this seminar and learning more about the intersection of transportation and data analytics.”
Titled “Freight Volume Modeling on Major Highway Links,” this event showcased the research of Dr. Luciano Nocera and his team, which includes Chrysovalantis Anastasiou, Computer Science PhD student, Seon Ho Kim, Associate Director of the Integrated Media Systems Center (IMSC), METRANS Director Genevieve Giuliano, and Cyrus Shahabi, IMSC Director. Dr. Nocera is a computer scientist and Associate Director (IMSC) where his research focuses on data analytics in health, transportation, and social media. He also teaches data visualization courses and develops educational games for various online programs.
Dr. Luciano Nocera
Computer scientist and the Associate Director at the USC Integrated Media Systems Center (IMSC)
The event was the second in-person seminar hosted by METRANS since March 2020, drawing an enthusiastic crowd of private sector transportation professionals, faculty, researchers, and students at all levels of study. The session began with a formal presentation and ended with a discussion of the audience’s questions, with continued discussion at a catered lunch with the participants and the speaker.
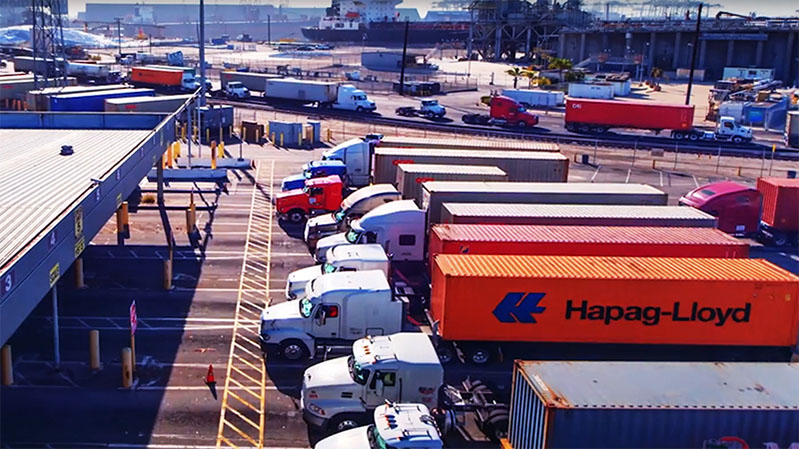
Dr. Nocera began the presentation by outlining why there is a need for more freight trucking data in Southern California. Freight trucking impacts several areas including infrastructure, traffic, and health. With more freight trucking data, roadway maintenance, traffic and accidents, and less polluting technologies could be better understood. The currently available freight data is very limited and little information is known about trucks’ origins and destinations. Additionally, existing data is indirectly sourced from surveys at ports, warehouses, and rail stations and is not always compatible with what is needed for urban planning and assessing truck impacts on traffic and air quality.
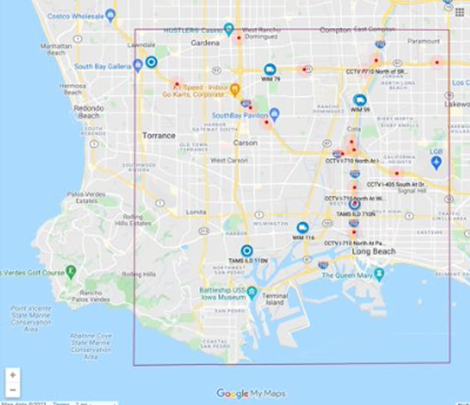
The region of study includes the Ports of Los Angeles and Long Beach and highway systems.
The sources of truck information that are currently available include precise but sparse sensors, such as weight-in-motion sensors, and data used for other applications, such as CCTV monitoring cameras. Traffic sensors on the highway system are good for counting the number of vehicles, but not good at identifying what type of vehicle is passing.
The goal of Dr. Nocera’s research is to provide high temporal and spatial resolution truck information in the form of an origin-destination (OD) matrix and link-level volumes by integrating the various sensor observations with general traffic sensor data. Some questions the research seeks to answer include the following: How to estimate an OD-Matrix from sensor observations? How accurately can the research model predict truck flow? Can Caltrans’ CCTV monitoring cameras be utilized to classify and count trucks on the highway?
Dr. Nocera then provided a simplified view of the problem from using currently available surveys to gather information about trucks on highways. The truck starts out at the origin, such as a port or rail station where the survey is taken, but there are then multiple destinations the truck can embark on from its origin. Because the survey is taken at the truck origin, it is only possible to know the truck’s origin from survey data. Whereas if sensor observations are used, this produces reliable counts that are associated with a time stamp. The truck observation at the sensor provides the time of the observation and the truck class of observation. The observations are then reconciled across sensors based on estimated travel times.
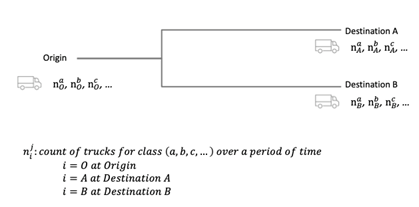
A mathematical representation of using survey information to inform the O-D matrix.
Dr. Nocera then outlined the three approaches that the research team developed: baseline, rule flow, and reach flow. The baseline approach estimates flow only at road segments where data is sensed. The rule flow approach extends estimation to adjacent edges as long as there is no road fork. Lastly, the reach flow approach finds compatible observations between sensors and inputs the flow on the edges of the shortest path between the sensors. Observations are compatible if travel time is approximately equal to their timestamp difference and detected truck type is the same.
The COVID-19 pandemic made it difficult to validate the freight model because of a lack of data and ground truth data (truck counts). To overcome this challenge, Dr. Nocera and the research team built a truck simulator that uses historical traffic data to simulate trajectories under different conditions. They also scraped Caltrans CCTV footage from available webcams. When the truck simulator is applied to the flow modeling validation, road network, sensors, and truck fleet initial conditions and destination are inputted into the truck simulator. The truck simulator is then able to generate simulated truck fleet observations and truck fleet trajectories. These observations and trajectories are then able to create the truck flow model that produces estimated OD-matrices and estimated volume on links (how much traffic there is).
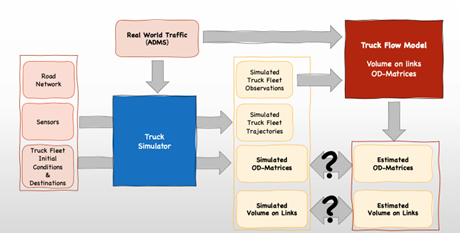
Visual representation of the truck simulator.
The results show that the more sensors there are, the more stable the results become. As sensors are added, the error rate continues to go down but the level of precision stays the same once there are 150 sensors. Dr. Nocera added that it is actually feasible to instrument roadways in such a way that a system is created that would provide planners, engineers, jurisdictions, and ports with truck information. However, it is difficult to determine where the best place to put these sensors are. Luckily, Dr. Nocera and his team have also built a dashboard that allows for different simulator scenarios.
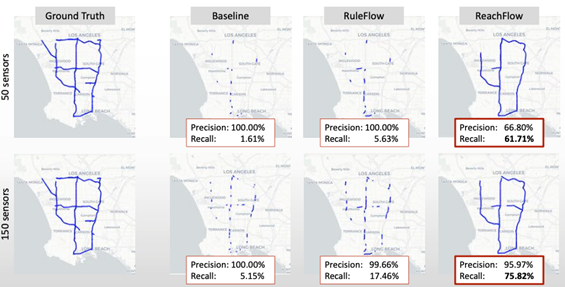
Results based on the different approached.
Dr. Nocera then continued by discussing the shortcomings of the Caltrans CCTV monitoring cameras. The CCTV is able to detect trucks traveling and capture this data, but it is often difficult to tell how many trucks are present, if the vehicle is a commercial van or not, and the vehicle classification which is based on number of axles. Dr. Nocera’s research has been working on classifying vehicles, particularly trucks, using CCTV monitoring cameras to better inform freight modeling research.
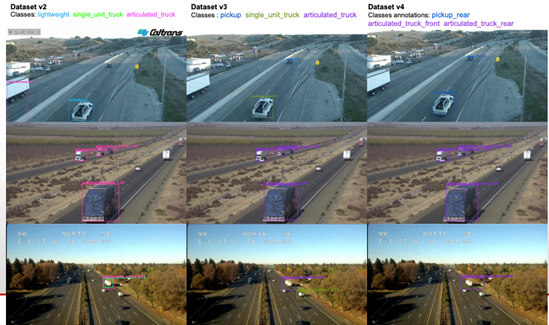
Vehicle classification applied to Caltrans CCTV monitoring camera images.
Dr. Nocera wrapped up the seminar by detailing his plans for future work related to freight modeling. Dr. Nocera hopes to use AI to create CCTV truck observations based upon CCTV location and the video footage associated with the CCTV cameras. The CCTV truck observations will help further freight modeling research by creating a clearer picture of where trucks are going once they leave their origin.
If you would like to watch the full video of the event or event highlights, or access the presentation slides, please click here.
About the Author:
Hayley Rundle is a second-year Master of Urban Planning student at the USC Price School of Public Policy, concentrating in Mobility and Transportation Planning. Hayley is interested in sustainable transportation planning to improve environmental quality, equity, and mobility for all. Hayley serves as the team leader for the METRANS Industry Engagement and contributes to the Student Research Team, summarizing cutting-edge transportation research projects and findings for the METRANS Fast Facts for Students series.
News Archive
- December (1)
- November (6)
- October (4)
- September (2)
- August (3)
- July (4)
- June (3)
- May (7)
- April (8)
- March (11)
- February (8)
- January (7)
- December (7)
- November (8)
- October (11)
- September (11)
- August (4)
- July (10)
- June (9)
- May (2)
- April (12)
- March (8)
- February (7)
- January (11)
- December (11)
- November (5)
- October (16)
- September (7)
- August (5)
- July (13)
- June (5)
- May (5)
- April (7)
- March (5)
- February (3)
- January (4)
- December (4)
- November (5)
- October (5)
- September (4)
- August (4)
- July (6)
- June (8)
- May (4)
- April (6)
- March (6)
- February (7)
- January (7)
- December (8)
- November (8)
- October (8)
- September (15)
- August (5)
- July (6)
- June (7)
- May (5)
- April (8)
- March (7)
- February (10)
- January (12)
2024
2023
2022
2021
2020
2019
2018
2017
2016
2015
2014
2013
2012
2011
2010
Major Funders


Metrans Associate Partners