News | PSR Research at UC Davis, University of Hawaii, and Northern Arizona University
Stop the VideoNews
PSR METRANS UTC
PSR Research at UC Davis, University of Hawaii, and Northern Arizona University
Thursday, September 6, 2018
There are currently several ongoing PSR research projects. Here we highlight projects nearing completion from UC Davis, University of Hawaii, and Northern Arizona University. The table below reflects the current developments of a few research projects that began in 2017. To read more about other PSR research projects, go to: http://bit.ly/2NrQfv8
UC Davis
Automated Analysis of Wildlife-Vehicle Conflict Hotspots Using Carcass and Collision Data - UC Davis - PI: Fraser Shilling
PSR Theme: Improving resilience and protecting the environment
Problem:
State Departments of Transportation are increasingly focused on the negative impact that wildlife-vehicle conflict has on both driver safety and ecological sustainability. A few states have engaged assistance from consultants and academia to discover hotspots of wildlife-vehicle conflict and possible solutions. Our project addresses the first need—to identify and prioritize locations of conflict and potential mitigation. Because many of the analytical steps can be repeated in automated systems, we are developing a web-system that allows DOT and other users to enter datasets and get back automatic and somewhat customized hotspot analyses.
Methodology:
We are using the statistical package R to test four methods for identifying hotspots: density of conflict incidents, cluster analysis with Getis-Ord, cluster analysis with Morans I, and combined cluster and density analysis with KDE+. We are partnering with DOTs to test their data in ID, NV, ME, and VA. We are using CA data that we collect from traffic incident reports (CHP) and volunteer observations of carcasses. We are also engaged in back and forth conversations with DOTs about rules for the analyses and most useful data outputs and guidance materials. We are closing in on the final step of automating the process through the web-system.
Present Findings:
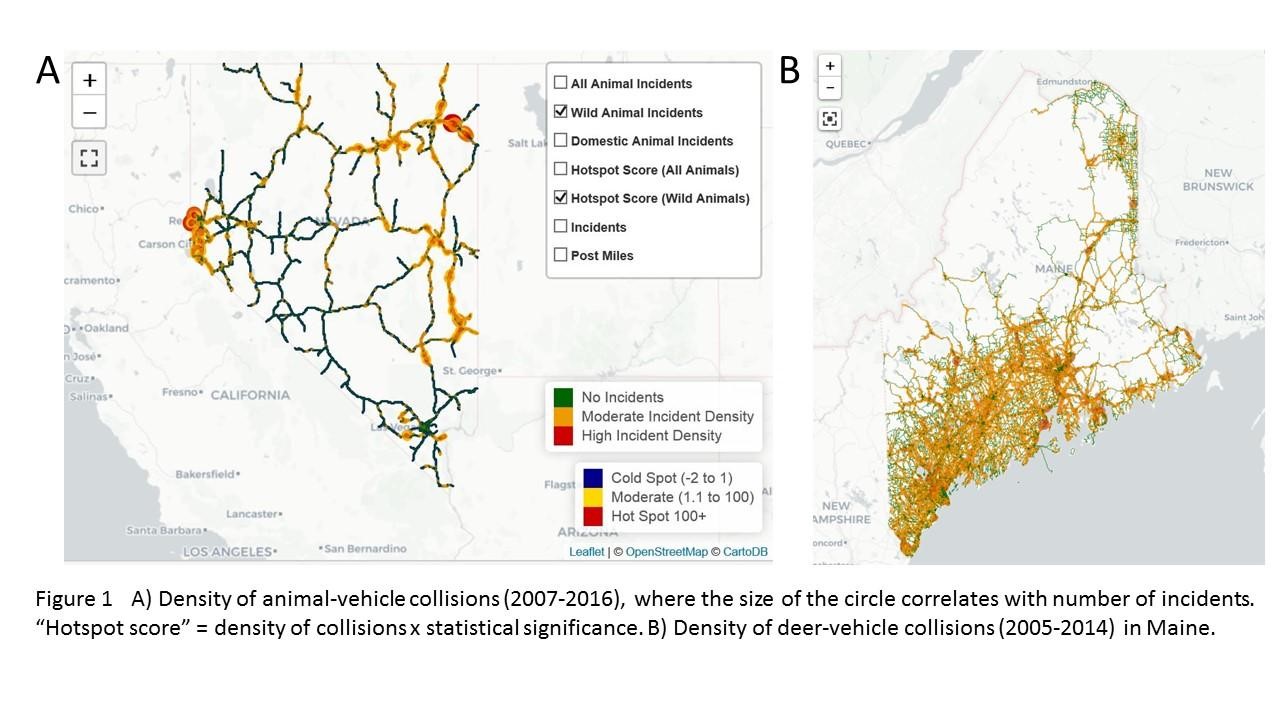
Partner state DOTs and their colleagues in wildlife management are enthusiastic about getting this type of help. They also can't quite believe that someone is doing this for them as it is a significant cost-reducer. We have tested multiple analyses and engaged in at least one exchange with NV and ME (Figure 1). We are entering this stage with ID and VA. For CA, we share data directly with Caltrans Districts and through our annual hotspots report.
Unexpected Outcomes:
In most states, there are true clusters of incidents (statistically different from neighboring highway segments). However, in ME, the incidents are not clusters, as moderate to high densities of conflicts are spread evenly along highways.
Next Steps:
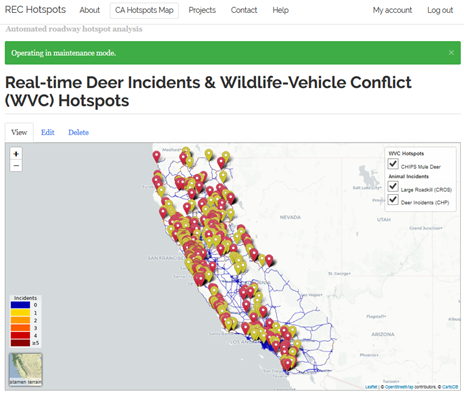
States increasingly maintain databases of wildlife-vehicle conflict (WVC), including locations of carcasses and crashes involving animals. Once these data are collected, a common and expensive barrier before they can be used in safety and environmental planning is identification of “hotspots” of incidents (here defined as locations of high-rates and/or statistically-significant clusters). With this PSR-supported project, we have developed a web-based analytical environment that state DOTs can use to automate certain analyses of WVC hotspots in order to inform planning to improve driver and wildlife safety. Specifically, we coordinated with staff from 3 states: ID, NV, and ME, and used data that we had for CA to develop the pilot automated hotspots analysis tool. We tested several methods for representing both density and statistically-significant clustering of WVC events. These were implemented in the statistical package R and driven by scripts that can operate in the project web-system. Testing has been primarily using CA data while other states prepared/delivered their data (sample here: https://roadecology.ucdavis.edu/hotspots/map). We have developed hotspots analyses for CA (Figure 2), ME, ID, and NV based upon their input. We are preparing the final web-system, which will be available here: https://roadecology.ucdavis.edu/hotspots, and that DOT staff from several states (CO, MN, TX, and VA) have agreed to test using their own data.
Northern Arizona University
Pedestrian Behavior at Signalized Intersection Crosswalks: An Observational Study of Factors Associated with Distracted Walking, Pedestrian Violations, and Walking Speed - Northern Arizona University - PI: Brendan Russo
PSR Theme: Urban Mobility
Problem:
In the past two decades, cellular phone and smartphone use in the United States has increased substantially. While mobile phones provide a convenient way for people to communicate, the distraction caused by the use of these devices has led to unintended traffic safety and operational consequences. Although it is well-recognized that distracted driving is extremely dangerous for all road users (including pedestrians), the potential impacts of distracted walking have not been as comprehensively studied. While practitioners should design facilities with the safety, efficiency, and comfort of pedestrians in mind, it’s still important to investigate certain pedestrian behaviors at existing facilities in order to minimize the risk of pedestrian-vehicle crashes, and to reduce behaviors that may unnecessarily increase delay at signalized intersections. This study aims to gain new insights into factors associated with distracted walking, pedestrian violations, and walking speeds. Ultimately, the results provide important information for researchers, practitioners, and legislators, and may be useful in planning strategies to reduce or mitigate the impacts of pedestrian behavior that may be considered unsafe or potentially inefficient.
Methodology:
A total of 3,038 pedestrians were observed across four signalized intersections in New York and Arizona using high definition video cameras. The video data were reduced and summarized, and an ordinary least squares (OLS) regression model was estimated to analyze factors affecting walking speeds, while binary logit models were estimated to analyze both pedestrian distraction and pedestrian violations.
Present Findings:
Several site- and pedestrian-specific variables were found to be significantly associated with pedestrian distraction, violation behavior, and walking speeds. The results of the walking speed analysis showed that pedestrians wearing headphones exhibited faster walking speeds, and that pedestrians walking in groups of two or more exhibited slower walking speeds, among other results. The results of the binary pedestrian distraction analyses showed, among other findings, that male pedestrians were less likely to talk on a phone while walking as compared with females, and that pedestrians walking alone were more likely to exhibit all three types of distraction (talking, texting, or wearing headphones). Additionally, pedestrians aged 16-29 were more likely to text on a phone while walking or wear headphones as compared with all other age groups. Finally, the pedestrian violation analyses indicated that males, pedestrians talking on a phone, and pedestrians in groups were more likely to commit violations.
Unexpected Outcomes:
The results of the walking speed analysis showed that talking and texting while walking were not significantly statistically associated with walking speed, indicating that pedestrians may be accustomed to walking while talking or texting and do not significantly slow (or increase) their walking speeds while engaging in these activities. This is important, as engineers may not necessarily need to reduce design walking speeds to accommodate distracted pedestrians when determining pedestrian clearance intervals as cell phone and smartphone use continues to increase.
Next Steps:
Our paper entitled “Pedestrian Behavior at Signalized Intersection Crosswalks: An Observational Study of Factors Associated with Distracted Walking, Pedestrian Violations, and Walking Speed” was published in the Transportation Research Record in 2018, and version of this work titled "Walking on the Wild Side: Distracted Pedestrians and Traffic Safety" was also published in TRANSFERS Magazine. Additionally, this work was presented at the 2018 Transportation Research Board (TRB) Annual Meeting and the 2018 Institute of Transportation Engineers (ITE) Joint Western and Texas District Meeting in Keystone, Colorado. The next steps for this research are to continue exploring the potential impacts of distracted walking; particularly at highway-railroad grade crossings. We conducted research this summer using video data from rail-grade crossings in Flagstaff, Arizona, and a TRB paper was submitted for publication and presentation at the 2019 TRB Annual meeting which examines factors which are associated with pedestrian and bicyclist violations, distraction, and crossing speeds at highway-rail grade crossings.
University of Hawaii
Physical Exposure and Social Sensitivity: Estimating Sea Level Rise Impacts to Transportation through Vulnerability Assessment and Social Media Analysis - University of Hawaii - PI: Suwan Shen
PSR Theme: Improving resilience and protecting the environment
Problem:
This project proposes to combine traditional transportation vulnerability assessments with social media analysis to assess the potential impacts of sea level rise on transportation so as to propose suggestions for adaptation. Through the examination of past coastal flooding events in Honolulu, it could provide empirical evidence for potential sea level rise impacts on transportation; examine the relationship between physical vulnerability and public-perceived impacts on transportation; and identify the most physically vulnerable and socially sensitive areas and people’s major concerns to support adaptation.
Methodology:
First, to develop the scenario for analysis, the magnitude and timing of extreme sea level occurrence will be extracted from historical Mean Higher High Water levels using tidal records provided by the National Oceanic and Atmospheric Administration (NOAA) Center for Operational Oceanographic Products and Services. The focus of the extreme value analysis is not to predict the future frequency with sea level rise but to extract the magnitude of current extreme events as empirical evidence for potential future conditions. Second, the affected transportation roadways will be identified under the selected coastal flooding scenarios. Network analysis will be used to evaluate the accessibility changes before and after the road network degradation to assess the physical impacts. Finally, publicly available social media data will be collected and analyzed to map the spatial distribution of social perception and sensitivity to the identified coastal flooding events. Historical Twitter data will be acquired from the Internet Archive (https://archive.org/). The physical vulnerability analysis and social sensitivity analysis will be compared to provide suggestions for adaptation.
Present Findings:
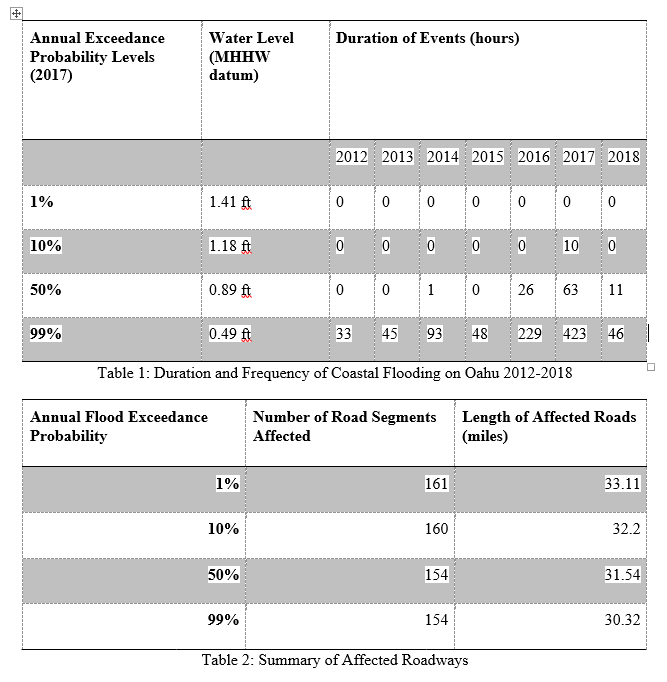
The number of tidal flooding events and durations increased in recent years, especially in terms of annual flooding events, shown in Table 1. The duration and frequency of transportation network disruption increases with such trends as well. People express their opinion and perception about their transportation status in social media, and the collected Twitter data show spatial variation (e.g. clusters) over the island. However, the association of the variation with the occurrence of flooding events needs to be further analyzed.
Unexpected Outcomes:
There are no significant differences among the extent and impacts of different tidal flooding (1%, 10%, 50%, 99% annual exceedance probability levels) on the transportation road network on Oahu as shown in Table 2. Although the duration and frequency of such nuisance flooding increases, the social sensitivity of such impacts may differ significantly depending on the location and time such as peak/off-peak occurrence. Such impacts will be tested using Twitter data.
Next Steps:
Following the initial vulnerability assessment, the project is conducting analyses to assess the impacts of king tides on the community's transportation accessibility. The assessment results will be compared with findings from social media analysis for validation. Physical and socially vulnerable communities will be identified and mapped and adaptation suggestions will be proposed accordingly.
News Archive
- December (1)
- November (6)
- October (4)
- September (2)
- August (3)
- July (4)
- June (3)
- May (7)
- April (8)
- March (11)
- February (8)
- January (7)
- December (7)
- November (8)
- October (11)
- September (11)
- August (4)
- July (10)
- June (9)
- May (2)
- April (12)
- March (8)
- February (7)
- January (11)
- December (11)
- November (5)
- October (16)
- September (7)
- August (5)
- July (13)
- June (5)
- May (5)
- April (7)
- March (5)
- February (3)
- January (4)
- December (4)
- November (5)
- October (5)
- September (4)
- August (4)
- July (6)
- June (8)
- May (4)
- April (6)
- March (6)
- February (7)
- January (7)
- December (8)
- November (8)
- October (8)
- September (15)
- August (5)
- July (6)
- June (7)
- May (5)
- April (8)
- March (7)
- February (10)
- January (12)
2024
2023
2022
2021
2020
2019
2018
2017
2016
2015
2014
2013
2012
2011
2010
Major Funders


Metrans Associate Partners